“The inverted hammer is a bullish candlestick pattern found after a downtrend and is usually considered a trend-reversal signal. The inverted hammer looks like an upside as well as the downside of the trend, This contains a small body at the bottom and a long higher shadow at the top. Also when it appears in an uptrend is known as a shooting star.”
This article will help you understand the how inverted hammer candlestick pattern formed and its purpose for investors and traders.
Table of Contents
Introduction
An inverted hammer Candlestick is a bullish single Candlestick Pattern, This candle is useful for identifying potential buying opportunities, The inverted hammer is treated as a bullish reversal, but only when it appears under certain conditions. So in this article, we understand all the important points.
What is Inverted Hammer Candlestick Pattern?

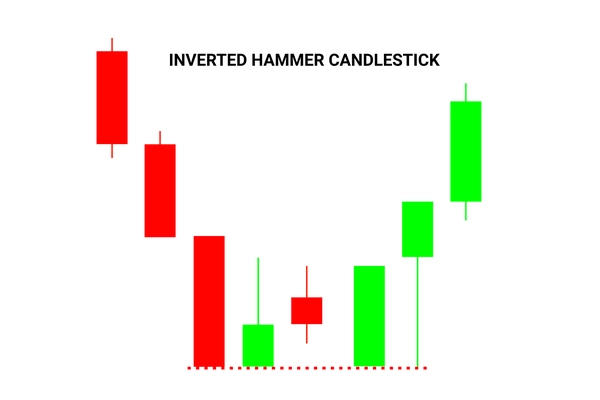
Image 1: Basics of Inverted Hammer Candlestick Pattern.
The inverted hammer is a bullish candlestick pattern found after a downtrend and is usually considered a trend-reversal signal.
This is a is a single candle pattern that contains a small body at the bottom and a long higher shadow at the top.
The inverted hammer candlestick pattern gets its name from its shape: it looks like a downward hammer. To identify an inverted hammer candle, look out for a long upper wick, a short lower wick, and a small body.
Sellers pushed prices back to where they were at the open the candle, but increasing prices shows that bulls are testing the power of the bears in this trading session.
the entire body tells the sellers in the market to exit as they may be a bullish reversal and tells the buyers to enter their buying position as the bullish trend is about to start after this given fall.
To get a clear idea about the candlestick pattern and what it looks like, please refer all the Images in this article with practical knowledge.
Understanding Inverted Hammer Candlestick Pattern with Example

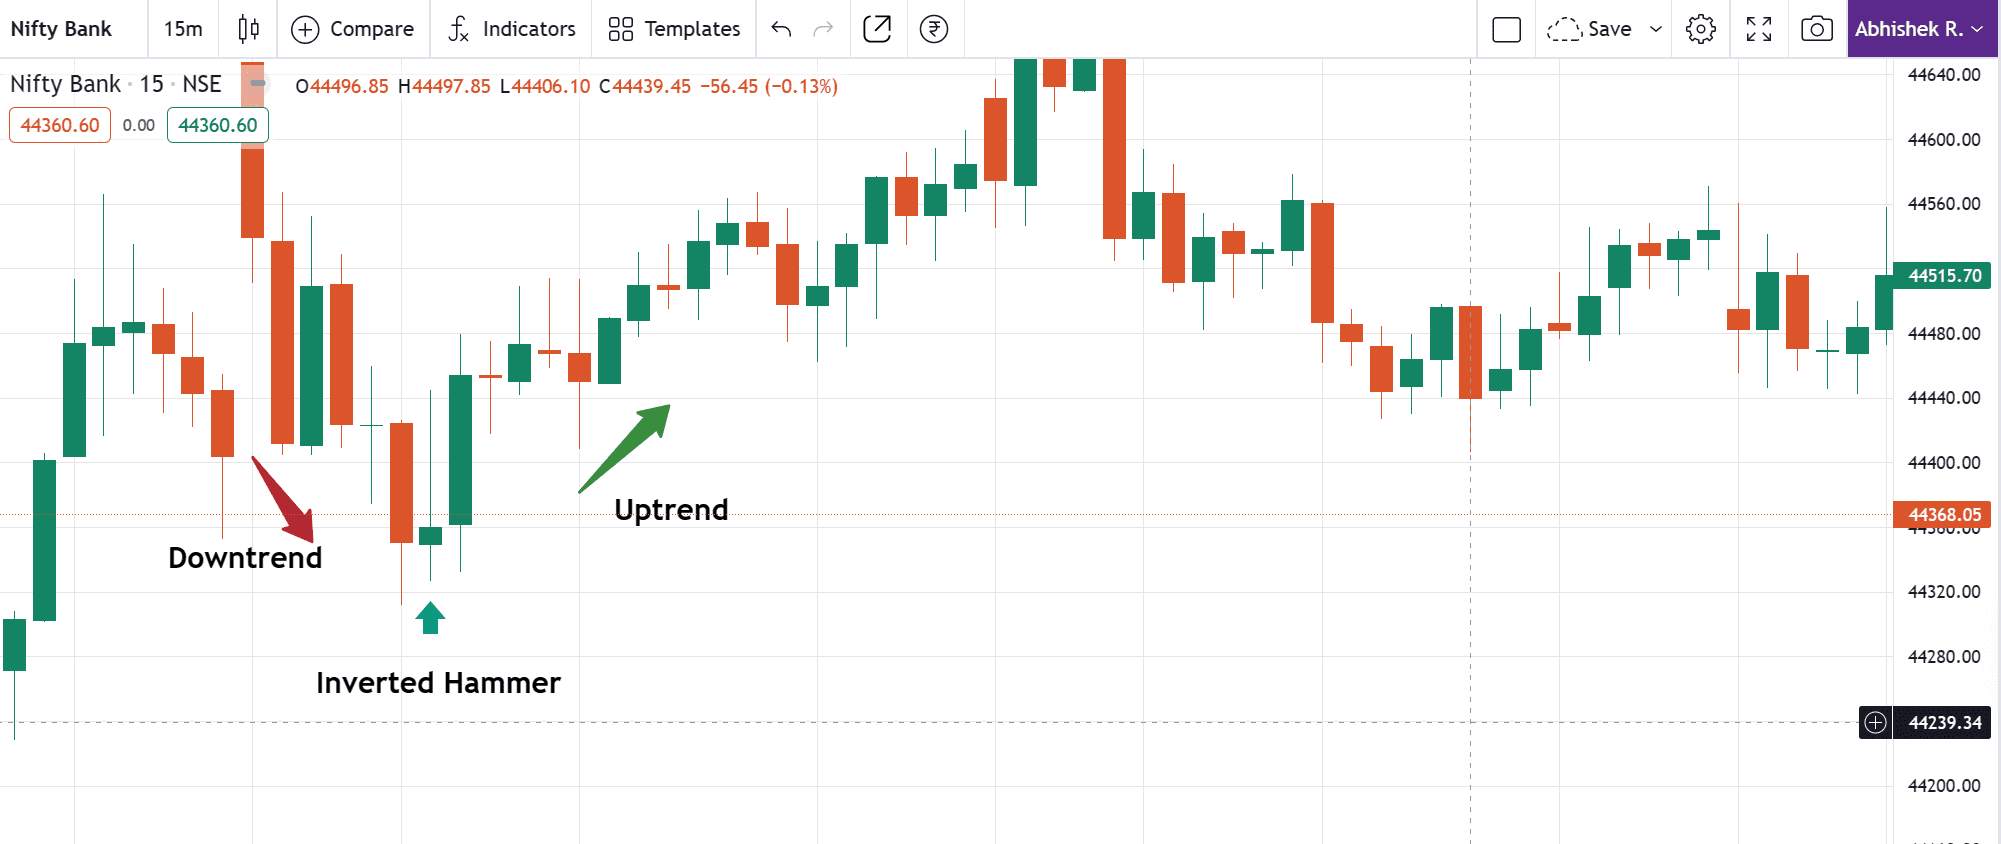
Image 2: Example in Bank Nifty Index chart.
Let’s look at a chart to understand how this candlestick looks on a stock chart and how it depicts a trend reversal.
When identifying this pattern, you should note the given points:
How to identify :
- Find the clear downtrend in the market and focus on a single candlestick. (The body of the candle must appear right after a downtrend)
- Identifying the candle, look out for a long upper wick (shadow), a short or no lower wick that includes a small body.
- The real body can be either bullish or bearish. (for better yet if bullish)
- While an inverted hammer can signal a potential reversal, So it’s more important us for to find confirmation, on the next candle price action.
- Note: Conversely, this candlestick formation is found at the bottom of a downtrend. (Avoid if it is formed in a sideways market)
Trade Guide
Inverted Hammer Candlestick Pattern: You must identify the pattern clearly, as several candlesticks might look like an inverted hammer (shooting star). Also, you must understand how it is formed and the reasons behind its formation so that you can identify it easily.
In trading or investing It is important to note that the Inverted pattern is a warning of potential price change, but it is not always correct this shows only potential on the basis of psychology.
Entry: Traders enter a long position as soon as they spot a formation on a chart. Confirmation may occur on the second bullish candlestick when breaks and closes above the high of the first given candle.
Exit: Approx 1:2 is better for us otherwise wait for a resistance level of the given swing.
Inverted Hammer Candlestick Pattern Stop-loss must be set lower of the candle to ensure that you do not lose too much money while using this pattern. It would be more beneficial if you set your stop-loss a couple of units below the bottom price of the inverted hammer’s candle.
You should only enter a trade if you are confident that the candlestick pattern will visually materialize and create its horizontal support.
Sometimes, huge candles can be traps, especially in volatile markets. Be cautious of false breakouts or breakdown confirmations.
Note: The this candlestick pattern is similar to its inverse counterpart of the shooting star candlestick pattern. These two are not to be mistaken for one another these two patterns are different from each other as the shooting star candlestick pattern often occurs after an uptrend or top of the chart.
To start trading today, open your 3-in-1 UPSTOX account. You can also sign up for a Try the platform if you want to practice trading.
Inverted Hammer Candlestick Trading Strategy Guide
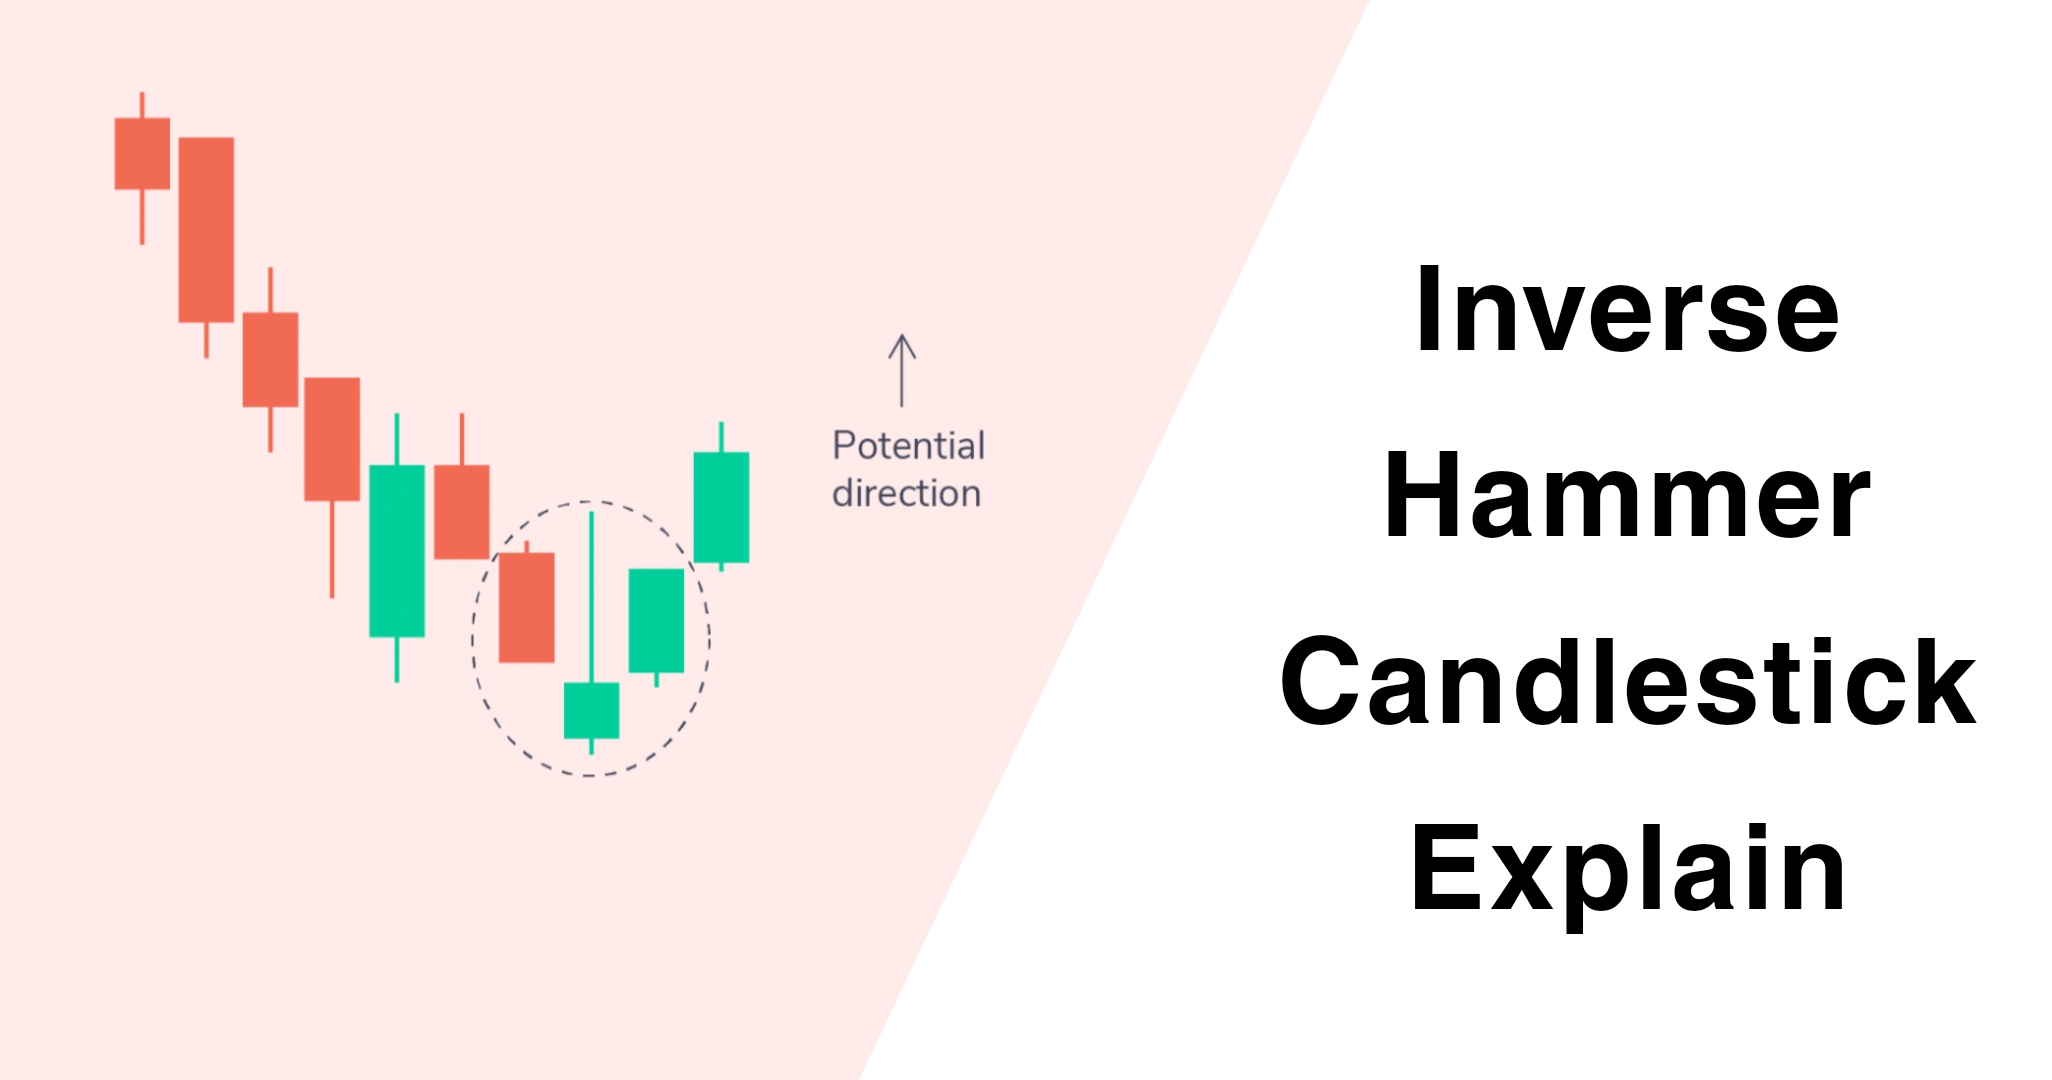
Image 1: Identify Pattern Correctly.
Image 2: Horizontal Support + Candlestick Strategy.
Image 3: Technical Analysis of Candlestick [ Improved ]
Limitations
While the period following the identification of the candlestick pattern may result in an upward reversal, there is no guarantee that this will last for an extended period of time. If buyers are unable to maintain their strength in the market, the index price may continue to fall
Difference Between Inverted Hammer Candlestick and Shooting Star Candlestick
The primary difference in that candlestick is the trend reversal pattern. Inverted hammers appear at the end of a downtrend while shooting stars appear at the end of an uptrend.
| Inverted Hammer Pattern | Shooting Star Pattern |
| Bullish reversal pattern. | Bearish Reversal Pattern. |
| Usually found at the downtrend of the chart. | Typically found at the top of the chart. |
| Small real body at the lower and about double the week size at the top in the trading session. | Same as an inverted hammer, But the psychological changes. |
Key Points
- Stock is in a downtrend, The candle looks like an inverted hammer appears. The trend could reverse
- Take a hammer and turn it upside down that how the inverted hammer candle look on the chart.
- For eg, the stock price opens at 100. rises to 105, falls again and closes to 101, this will create an inverted hammer candlestick formation.
Final Conclusion
In conclusion, you must understand the candlestick pattern to conduct a technical analysis before you make any decisions on behalf of this pattern. The pattern can be used by both beginners and experienced traders in the market who want to understand trend reversal chances. However, even if you use the pattern to make trade decisions, you must not forget to place stop losses and safeguard yourself from the uncertainties of the stock market that protect your capital.
Remember Trading carries inherent risks, and it’s important to trade responsibly and never risk more capital than you can afford to lose. Some people lose their capital without a proper plan execution and psychological issues, and they don’t handle their risk management in crucial situations.
We hope you found this blog informative, Leave a comment below and share your thoughts with LearnX. Your feedback is most valuable!
Happy trading!
Reference – Wikipedia Candlestick Pattern
FAQ (Frequently Asked Questions)
Can a trader, use this pattern in intraday?
Yes, this candlestick pattern is most used during intraday trading as it showcases a price movement.
How is it used in trading?
Traders may use it as a signal to consider long positions or exit short positions.
Is inverted hammer bullish?
The inverted hammer is a bullish reversal pattern that sows upward strength after a major downtrend.
which is a stronger hammer or an inverted hammer?
The hammer is considered stronger than the inverted hammer because in the hammer contains only a buyer that shows more potential.
Read more: Bullish Harami Candlestick Pattern Explained


