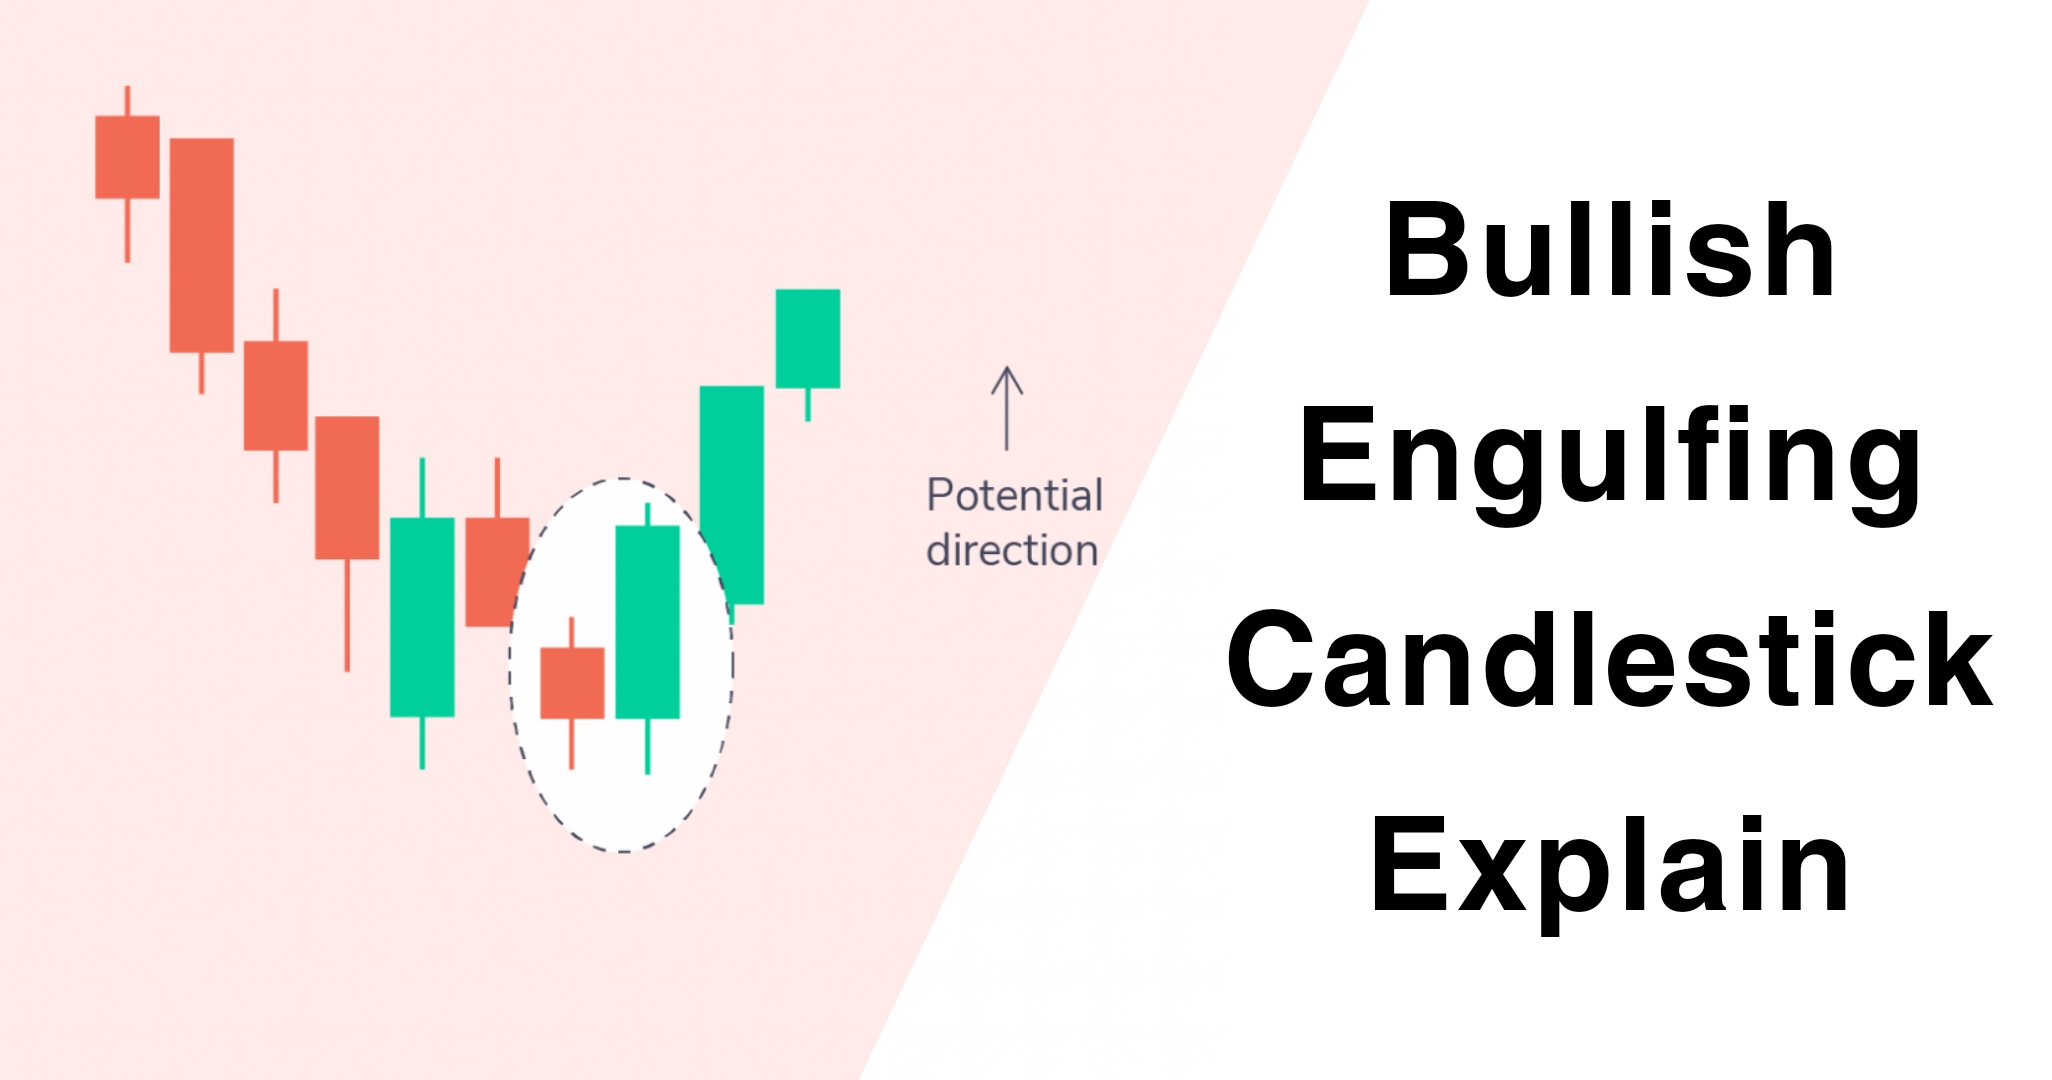
“The bullish engulfing candlestick pattern consists of two candles, where the second bullish candlestick’s body completely engulfs or covers the first bearish/red candlestick’s body. It is formed after a downtrend in the chart.“
So in this article, we will understand how the Bullish Engulfing Candlestick Pattern formed and how we can make trading decisions with it using technical analysis.
Introduction
A bullish engulfing candlestick is a two-candles Pattern, Most of traders use this pattern in their trading as a strategy to identify potential buying opportunities, This pattern suggests that sellers may be losing momentum and buyers are starting to take control. The bullish engulfing is treated as a bullish reversal, but only when it appears under certain conditions. So in this article, we discuss all the important points and master this pattern.
What is the Bullish Engulfing Candlestick Pattern?
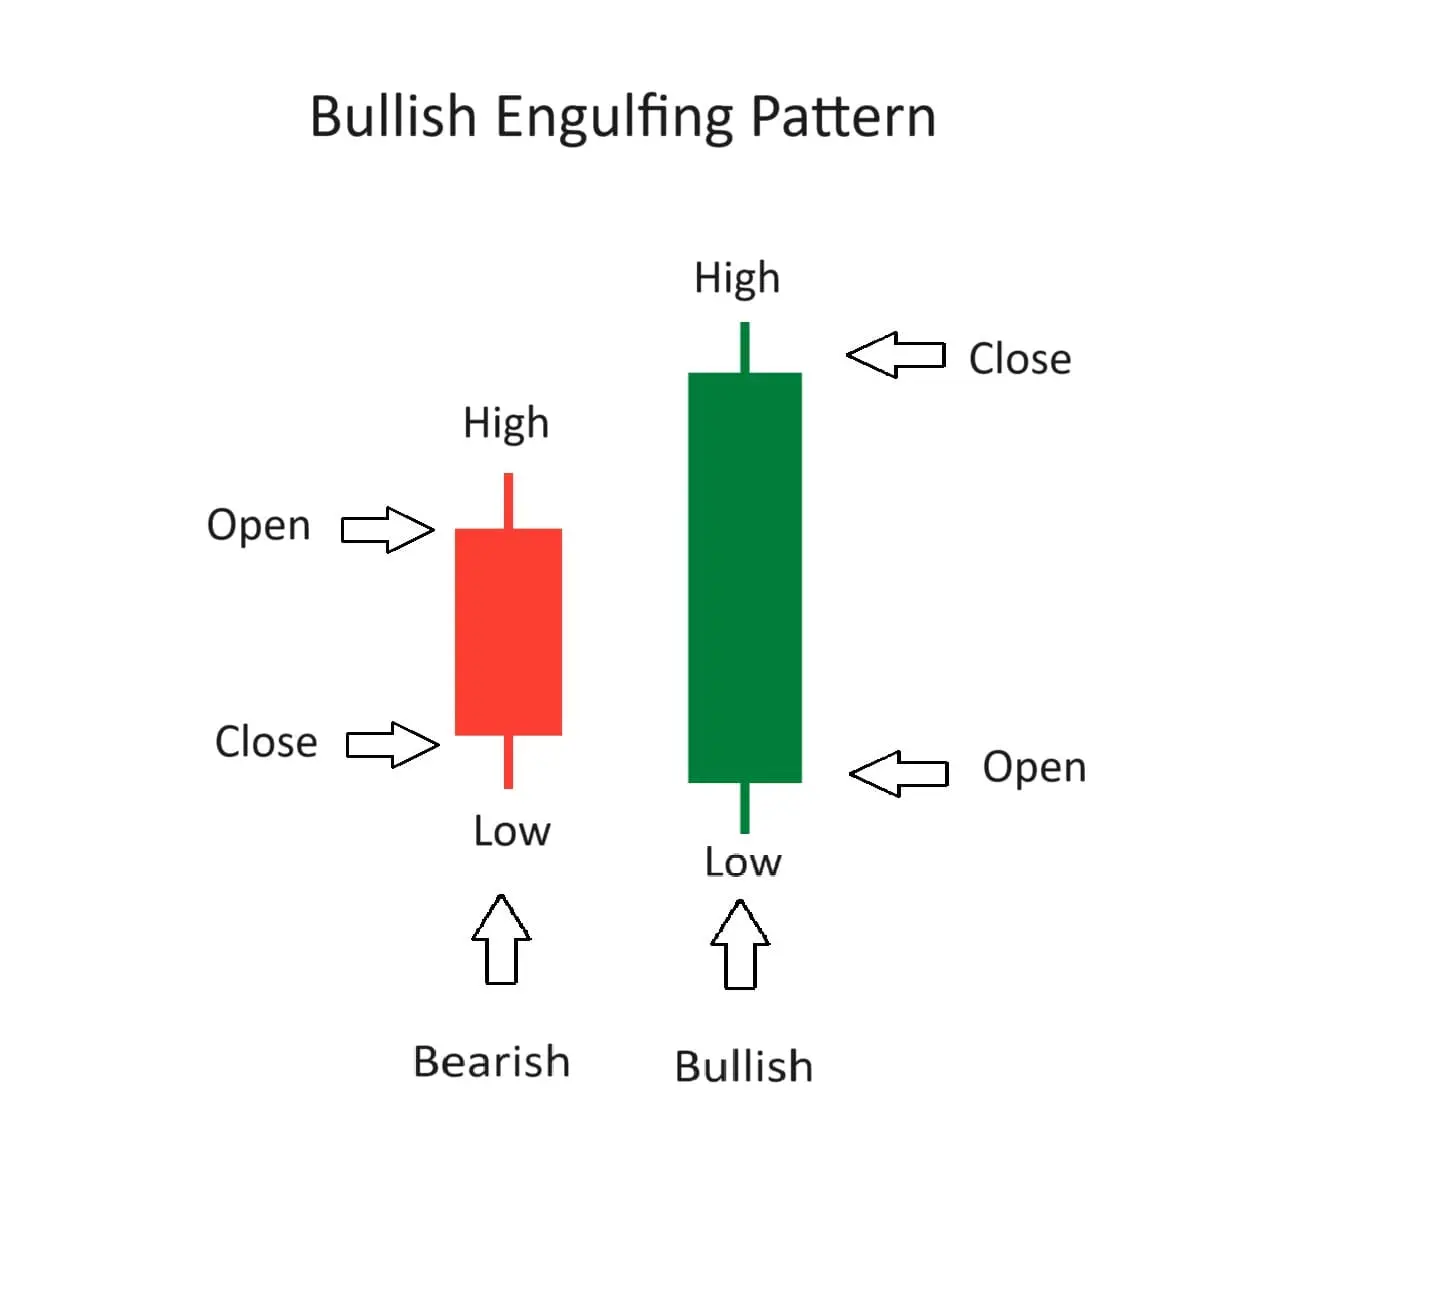
The bullish engulfing candlestick pattern consists of two candles, where the second bullish candlestick’s body completely ‘engulfs’ or ‘overlaps’ the first or previous bearish/red candlestick’s body.
The green candlestick of a bullish engulfing pattern typically has a small upper wick, That means the candle closed at or near its highest price, suggesting that the candle ended while the price was still surging upward and changing the current direction possibilities.
The bullish engulfing candlestick has formed after a downtrend and shows a potential (bullish) reversal/retracement in the market.
To get a clear idea about the Hammer Candlestick pattern and what it looks like, please Refer to the Images of this article with practical knowledge.
Understanding Bullish Engulfing Candlestick Pattern with Example
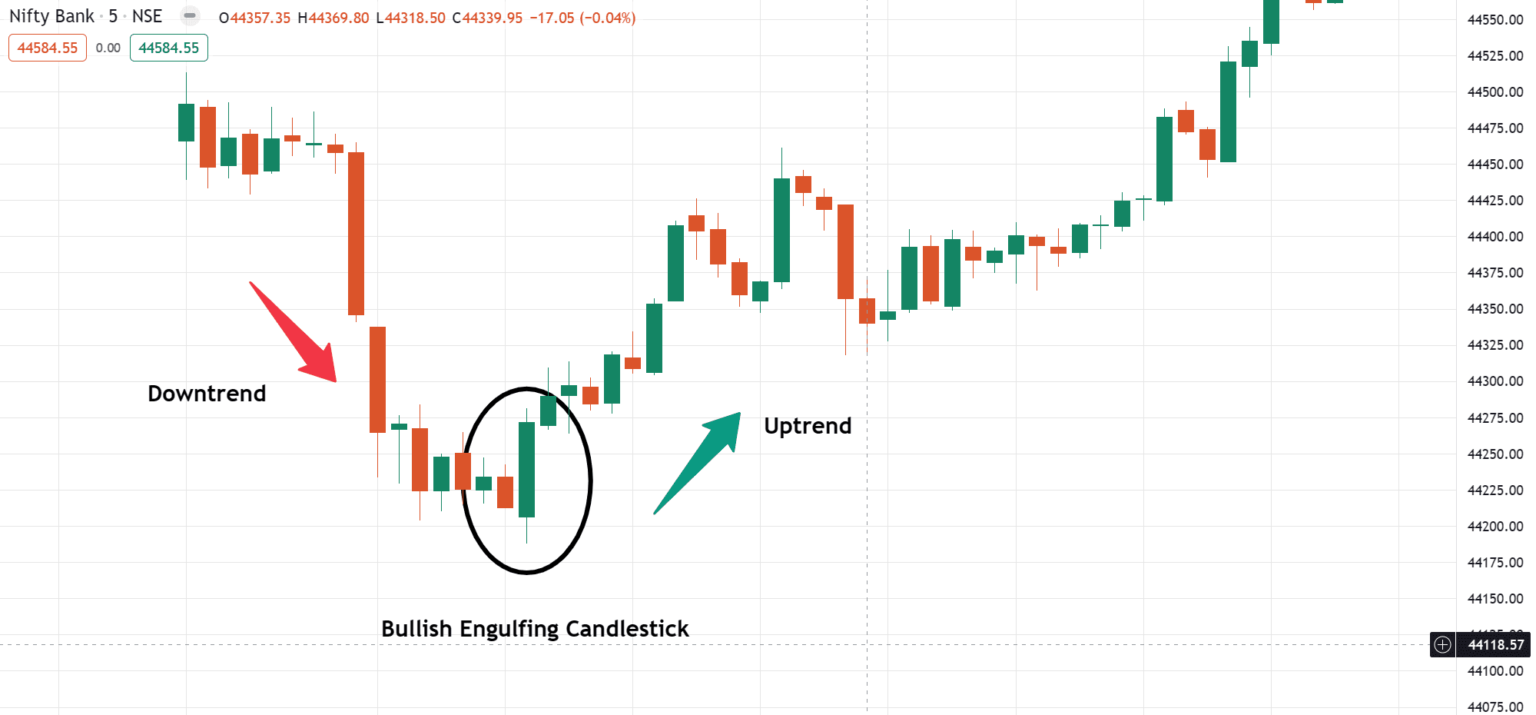
When identifying this pattern, you should note the following points:
How to identify:
- First, find a clear downtrend in the market.
- At the bottom of the downtrend, there should be a small red candle.
- The second candle completely engulfs the body of the first or previous red candle.
- Note – The first candle is bearish or red & Second one is bullish or green.
Trade Guide
Traders should enter long positions only after the confirmation of the second candle closing above the previous candle and it completely overlaps. Now a stop-loss can be placed at the low of the same candle.
A bullish engulfing candlestick pattern is a bullish reversal signal characterized by two candles, The second bullish candle body completely engulfs the first candle, just shown in the examples, The bullish engulfing candlestick pattern indicates potential upward price movement. As per our experience when you master it you get approximately 50-80% accuracy.
The stop loss can be placed below the recent swing low – which is the low of the Second Candle. The target limit can be placed at a key level that the price has bounced off previously, provided it results in a positive risk-to-reward ratio.
Moreover, if the second candle is huge and long, it can practically close the door for you to open a new trade.
It is simple to recognize the bullish and bearish engulfing patterns just you can see this image, once you are familiar with them, this pattern offers traders good risk-to-reward ratios.
Bullish Engulfing Candlestick Pattern Trading Strategy Guide
- Image 1: Identify Bullish Engulfing Pattern.
- Image 2: Horizontal Support + Engulfing Candlestick Strategy.
- Image 3: Technical Analysis of Engulfing Candlestick [ Improve ]
Psychology of Bullish Engulfing Candlestick Pattern
This pattern shows ongoing trend is a downtrend, the prices keep or make new lower lows. So in the current downtrend, a small bearish candlestick is formed as the market is expected to move lower but now the second candle, the price opens below the previous candle closing, and the price attempts to make a new low. But this opening price becomes the low price of the day as there is suddenly buying interest by the bulls that raises the prices to close higher than or above the first candle open price. This indicates that the bulls are strongly back into the action and now the trend may be reversed to the uptrend.
- Find the Correct Engulfing Candlestick Pattern.
- Check the conditions like lower low formation or at the horizontal support level.
- Wait for Confirmation and Enter after confirmation.
- Don’t Overthink and place stoploss accordingly.
- Wait for Target or SL.
Understanding Engulfing candlesticks and other candlestick patterns takes some time and practice. It’s not something you can master in a single overnight. So, new traders might make mistakes while learning but they gain some big knowledge.
Limitations of Bullish Engulfing Candlestick Pattern
This engulfing pattern consists of two candles, So the second candle may also be large or huge. This can leave a trader with a very large stop loss if they opt to trade the engulfing pattern. The potential reward from the trade may not justify so the risk is huge as per conditions.
Bullish engulfing candlestick patterns are also challenging to determine the possible reward because these candlesticks don’t offer a specific price target. Instead, traders will also need to employ their alternative strategies, including trend analysis or indicators, to pick a price goal or decide when to exit a winning trade.
Engulfing patterns are particularly helpful for traders since they make it obvious when momentum is shifting upward after some downtrend.
In simple language, while engulfing candlesticks can be helpful, they’re not a magic solution. They have limitations if you use these limitations in your trading journey you can protect your capital from critical decisions.
Difference Between Bearish Engulfing and Bullish Engulfing Candlestick Pattern
These two patterns are opposites of each other. A bearish engulfing pattern occurs after an uptrend and indicates lower prices to come. Here, the first candle, in the two-candle pattern, is a green candle. The second candle is a larger red candle, with a real body that fully engulfs the smaller up candle. It is completely the opposite of bullish engulfing if you learn the bullish pattern completely you can easily find this pattern also.
Key Points of Bearish Engulfing Candlestick Pattern
- The Bullish Engulfing is a bullish reversal candlestick pattern that occurs at the bottom of a downtrend and suggests a potential reversal or retracement from a downtrend to an uptrend.
- This Candlestick doesn’t provide a price target It doesn’t tell you how big the direction of the trend comes but most of the traders plan 1:1 or 1:2 Targets.
If Bullish Engulfing fails the next candle achieves a new low. (As per my research)
The Bullish Engulfing can be used in various timeframes like 1min, 3min, 5min, 15min, and more as per your conditions and, you can also use in different financial markets. it is a versatile tool for traders.
Pro Tips:
The risk-reward ratios are most important for managing trader profitability. A 1:2 risk-reward ratio means that even if you win on only 50% of your trades, you will still be profitable.
Also Read: Hammer Candlestick Pattern Explained
Final Conclusion of Bearish Engulfing Candlestick Pattern
In conclusion, The bullish engulfing candlestick pattern is a powerful bullish pattern for traders to identify the potential trend reversal signals and predict future market opportunities. However, it is not a guarantee of success but this candle shows the possibility/probability that the market has changed its direction. When you master it you get approximately 50-80% accuracy. Traders like the bullish engulfing also because it’s like a hopeful signal for day traders after a gloomy time.
Remember Trading carries inherent risks, and it’s important to trade responsibly and never risk more capital than you can afford to lose. Some people lose their capital without a proper plan execution and psychological issues, and they don’t handle their risk management in crucial situations.
F&Q Related to Bearish Engulfing Candlestick Pattern
What is a bullish engulfing candlestick pattern?
A bullish engulfing pattern is a two-candlestick pattern where the second candle completely engulfs the previous candle showing a potential reversal from a downtrend to an uptrend.
How do I identify a bullish engulfing pattern?
A smaller bearish candle followed by a larger bullish candle that completely covers or engulfs the complete body of the first candle.
Which timeframes are best for bullish engulfing?
Many traders consider it more usable on higher timeframes, such as a long timeframe like daily or weekly charts.
What does bullish engulfing tell traders?
This candlestick tells the trend reversal to the upside after selling pressure loses momentum at this key level.
What are the advantages of trading with the bullish engulfing candle?
the bullish engulfing candle is easy to identify and attractive entry levels can be obtained after receiving confirmation of the bullish reversal so this is helpful for all the traders.
What is the best frame for engulfing candlestick?
Based on the most recent back-tested data, the daily timeframe is ideal for trading bullish candlestick patterns, particularly the engulfing candlestick pattern, with relatively short holding periods of one to ten days.
Different variations of the bullish engulfing pattern?
piercing line pattern, kicker pattern – where the second candle closes within the body of the first same as bullish engulfing, but significant changes found.

