Harami is a two-candle pattern that signals a potential reversal in a downtrend. The first candle is usually strong and long, the second candle has a small body that is completely inside the range of the previous candle. The second candle is generally opposite in colour to the first candle. A Harami candlestick is also known as an inside candle.
So in this article, we understand how the Bullish Harami candlestick is formed and how we can make trading decisions with this pattern using technical analysis.
Introduction
The Bullish Harami candlestick pattern is a two-candle pattern, Some peoples use bullish harami candlesticks in their trading as a bullish sign to identify potential buying opportunities in financial markets, as it suggests that sellers may be losing momentum and buyers are starting to take control. The bullish harami is treated as a bullish reversal, but only when it appears under certain conditions. So in this article, we discuss all the important points and master this pattern.
What is Bullish Harami Candlestick Pattern?
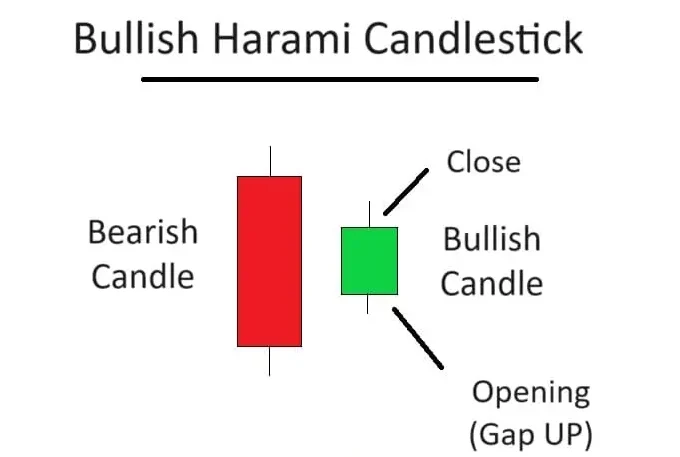
Harami is a Japanese term that means pregnant woman. The combination of candlesticks where the first candle is ‘pregnant’ with the second smaller candle is a also known as a baby candle just you can see the diagram its looks like a pregnant.
The Bullish Harami candle pattern is a reversal or a retreatment pattern appearing at the bottom of a downtrend. It consists of a two candles. The formation of a bullish harami like a bearish candle with a large body, followed by a bullish candle with a small body enclosed within the body of the previous candle.
Bullish Harami Pattern which gives a bullish trend reversal signal and its forms in a downtrend.
There are two types of harami patterns – the bullish harami and the bearish harami.
To get a clear idea about the bullish harami candlestick pattern and what it looks like, The formation process please refer to all the Images in this article with practical knowledge.
Understanding Bullish Harami Candlestick Pattern with Example
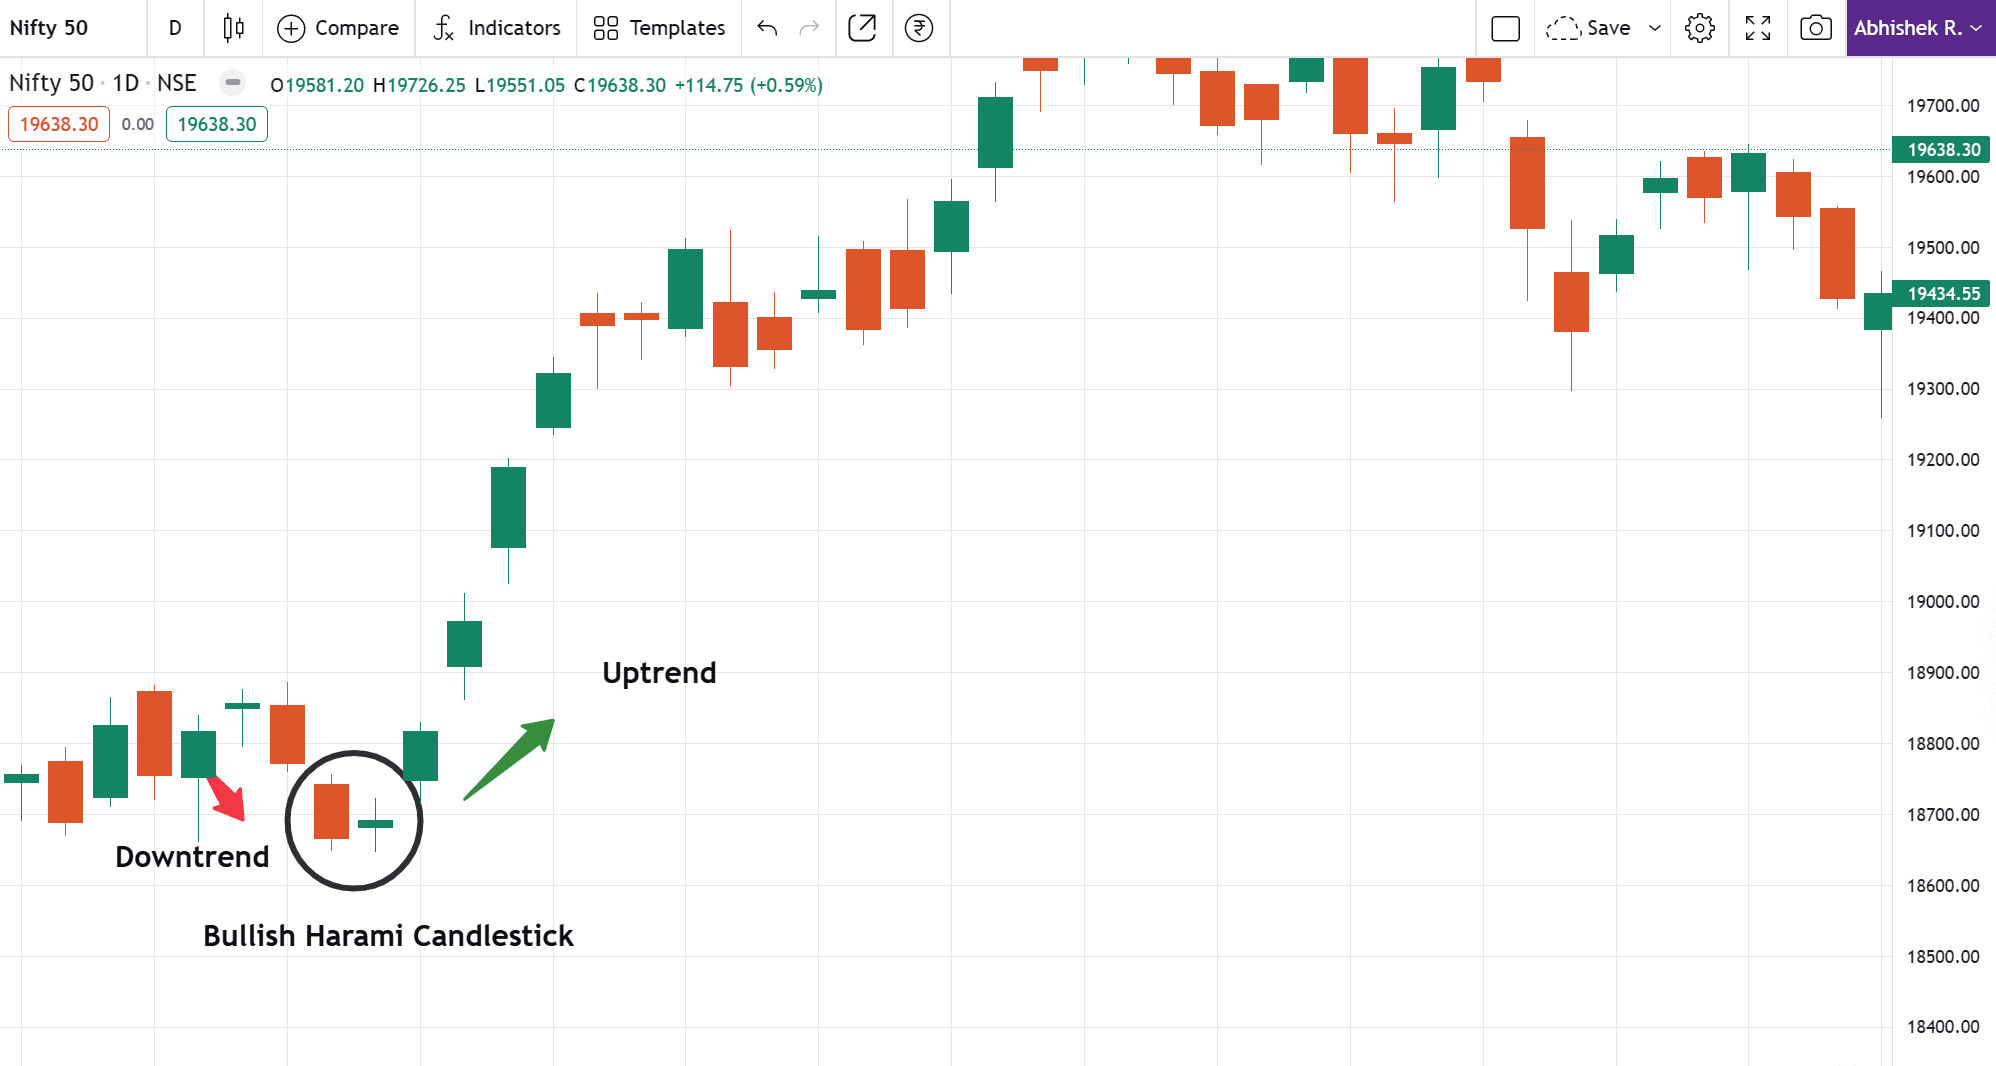
In the above chart, the bullish harami pattern occurred.
- The market is in a downtrend pushing the prices lower and lower.
- On the 1st day or first candle of the pattern, a red candle with a new low is formed in a particular swing, reinforcing the bear’s strong position in the market.
- On the 2nd day of the pattern, the market opens a gap up at a price higher than the previous day’s close of a bearish candle. On seeing a high opening price, the bears are panicking, as they would have otherwise expected a lower opening price but unfortunately prices are under the control of buyers.
- The price action on the second trading session creates a small blue candle that appears contained (pregnant) within first long red candle.
- The small green candle on a standalone basis looks harmless, but what really causes the panic is that the bullish candle appears suddenly when it is least expected.
- The expectation is that panic amongst the bears will spread faster and they will destroy their positions, so giving a greater push to bulls. This tends to push the prices higher and higher. Hence one should look at going long using a bullish harami candlestick pattern.
When identifying the Bullish Harami pattern, you should note the following points:
How to identify:
- First, find a clear downtrend in the market.
- At the bottom of the downtrend, there should be a Baby candle with a new low.
- The First is a strong bearish candle.
- Note – The first candle is bearish or red the second one is small or Inside like a baby candle.
After this pattern is complete, we can see that a strong up move has emerged. This pattern also confirms that a bullish trend reversal or retracement has taken place. A trader may see this as a potential trend reversal when the pattern is being formed in or at the support level.
Trade Guide on Bullish Candlestick
Entry Level: Traders enter a long position as soon as they spot a formation on a chart at the horizontal support level. However, it’s important to wait for confirmation before entering the trade so you don’t trap. Confirmation may come as the next bullish candlestick after the formation is completed or when breaks above a resistance level and closes the green candle above the first bearish candle. Entering a trade too early can increase the risk of loss so always get confirmation to secure or avoid some tap losses.
Target Level: Take-profit level can be set by identifying a potential horizontal resistance level because this candle does not give or suggest how long trend will continue. Traders look at previous price actions or use technical analysis tools such as trendlines or indicators to get an idea.
Stop Loss: Enter a long position with a stop-loss order below the lowest level of the first bearish candlestick. Stop-loss helps limit potential losses if the setup fails to play out as expected.
Pro Tip: The 1:2 risk-reward ratio works best in this pattern. A 1:1 ratio may not be profitable sometimes. Therefore it is advised to maintain a 1:2 risk/ reward ratio that helps you most in your trading journey.
Note: Harami patterns have an accuracy of around 60% as per our research, so other patterns give you a better risk reward.
Bullish Harami Candlestick Trading Strategy Guide
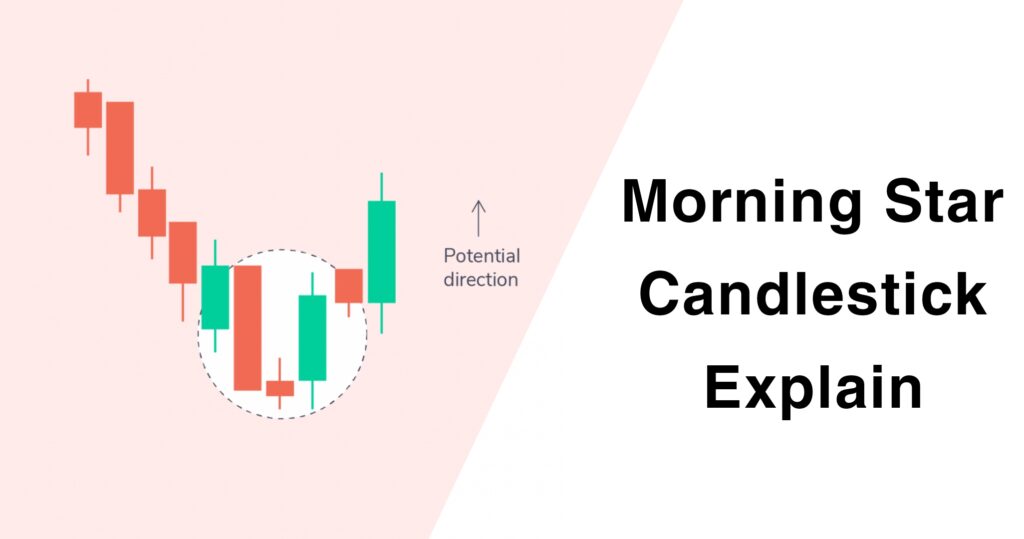
- Image 1: Identify Morning Star Pattern Correctly.
- Image 2: Horizontal Support + Bullish Harami Candlestick Strategy.
- Image 3: Technical Analysis of Bullish Harami Candlestick.
What is the Psychology behind the Bullish Harami Pattern?
This topic was updated soon on the second review.
Limitations
Bullish Harami candlestick pattern can provide valuable insights into potential trend reversals, but it’s essential to be aware of all of its limitations:
In many technical patterns including Bullish Harami signals are not infallible. Sometimes, they may indicate a potential reversal, but the market doesn’t follow through as expected. It’s generally recommended to wait for confirmation before acting on a Bullish Harami signal. Such as higher trading volumes or confirmation from other technical indicators. Traders should always consider the potential losses and set appropriate stop-loss orders to protect capital.
The Bullish Harami shifts bearish sentiment to bullish sentiment, but market conditions can change quickly. External factors such as economic events or geopolitical developments can override the signals provided by candlestick patterns.
Market conditions and other factors should be important to consider for analysis. Like any tool, it’s not foolproof. A trader must keep in mind other technical parameters important to initiate the trade.
In simple language, while this candlesticks can be helpful, they’re not a magic solution. They have limitations if you use these limitations in your trading journey you can protect your capital from critical decisions.
Difference Between Bullish Harami Candlestick and Bearish Harami
| Bullish Harami Candlestick Pattern | Bearish Harami Candlestick Pattern |
| This is a bullish reversal pattern It occurs during a downtrend. | This is a Bearish It occurs during an uptrend. |
| The first candle is a large bearish candle, indicating selling pressure. | The first candle is a large bullish candle, indicating buying pressure. |
| The second candle is a smaller bullish candle like a baby candle | The second candle is a smaller bearish candle like a baby candle |
| buyer gaining strength. | sellers gaining strength. |
Final Conclusion
In conclusion, the bullish harami candlestick pattern is a useful pattern for all the traders to read charts, Its two candle structure. However, traders should exercise and take caution. Considering its limitations and the need for additional analysis. However, it is not a guarantee of success but this candle shows the possibility/probability that the market has changed its direction.
Using Harami pattern trades does not guarantee accuracy. Therefore it is best to take trade confirmation from using other indicators.
Additionally, traders must be mindful of false signals and adjust their trading strategies accordingly to increase their chances of success. Once you feel confident in your strategy, you can open a trading account and apply it to live trading.
Remember Trading carries inherent risks, and it’s important to trade responsibly and never risk more capital than you can afford to lose. Some people lose their capital without a proper plan execution and psychological issues, and they don’t handle their risk management in crucial situations.
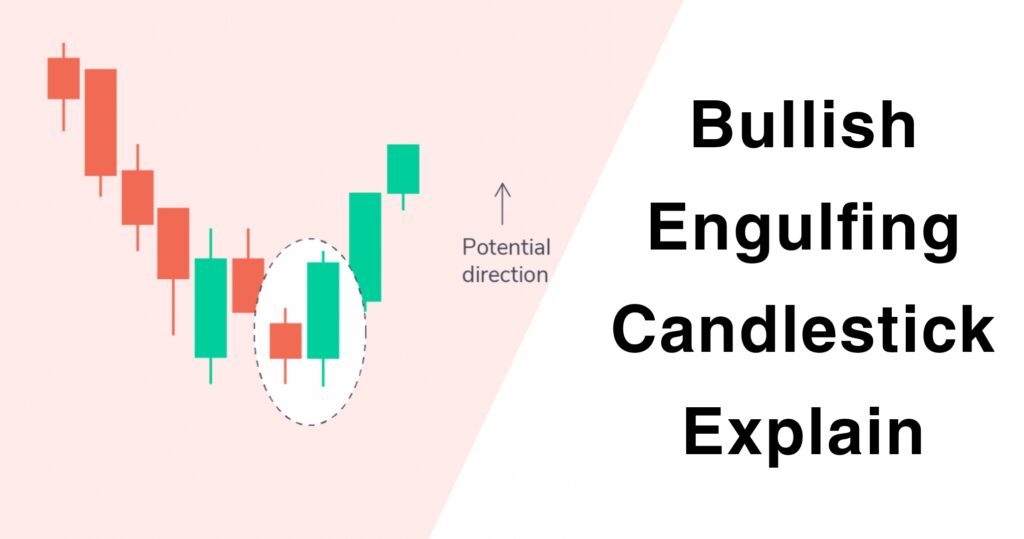
Also Read: Bullish Engulfing Candlestick Pattern Explained
FAQ (Frequently Asked Questions)
How to identify a Harami Candle?
Harami Candle consists of a large candle followed by a smaller bearish candle completely inside within the range of the first candle this candle also known as a baby candle.
How many types of Bullish Candlestick Patterns?
Hammer, Bullish Engulfing, Morning Star, Marubozu, Inside up this is types of bullish candlestick patterns
How do you trade Bullish Harami candlestick?
First Identify the downtrend, Look for a large bearish candle followed by a smaller baby candle, Enter a long position on third candle closing above. Use stop-loss for risk management.
Is the Bullish Harami accurate?
As per our experience when you trade on bullish harmi you get approximately 60% accuracy found.

