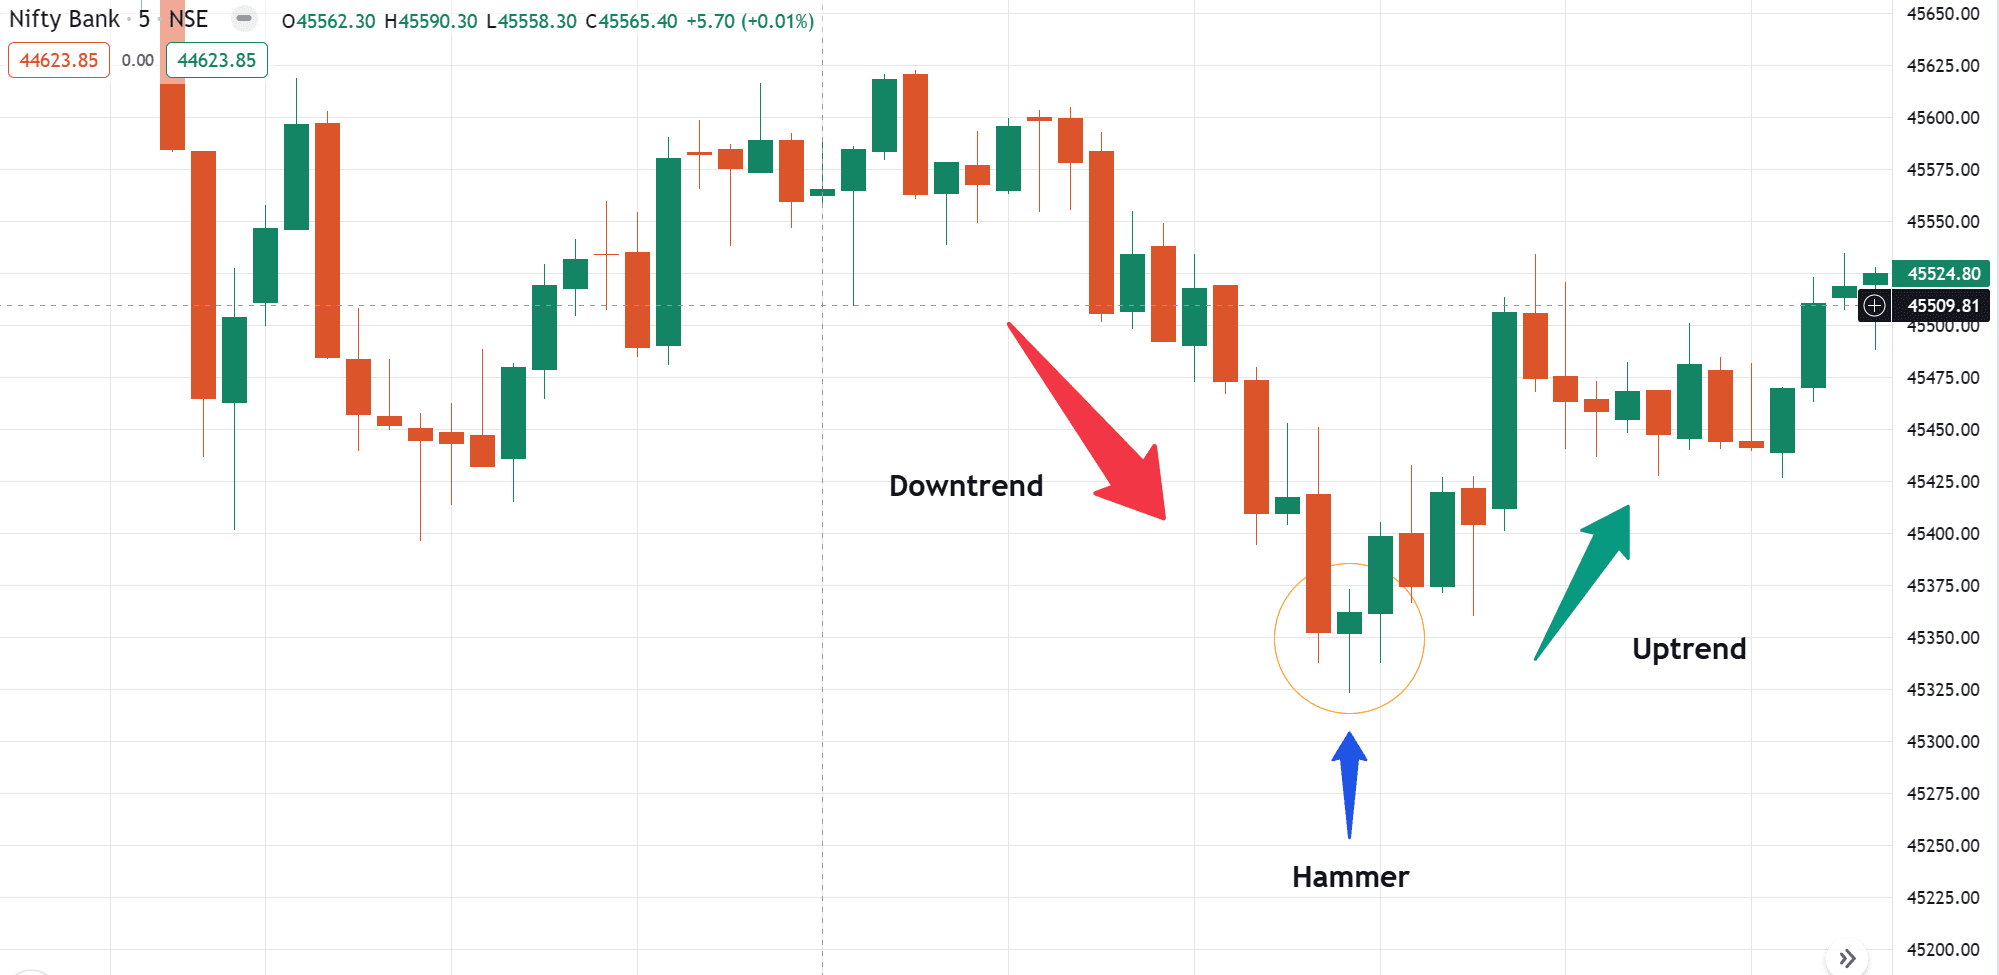
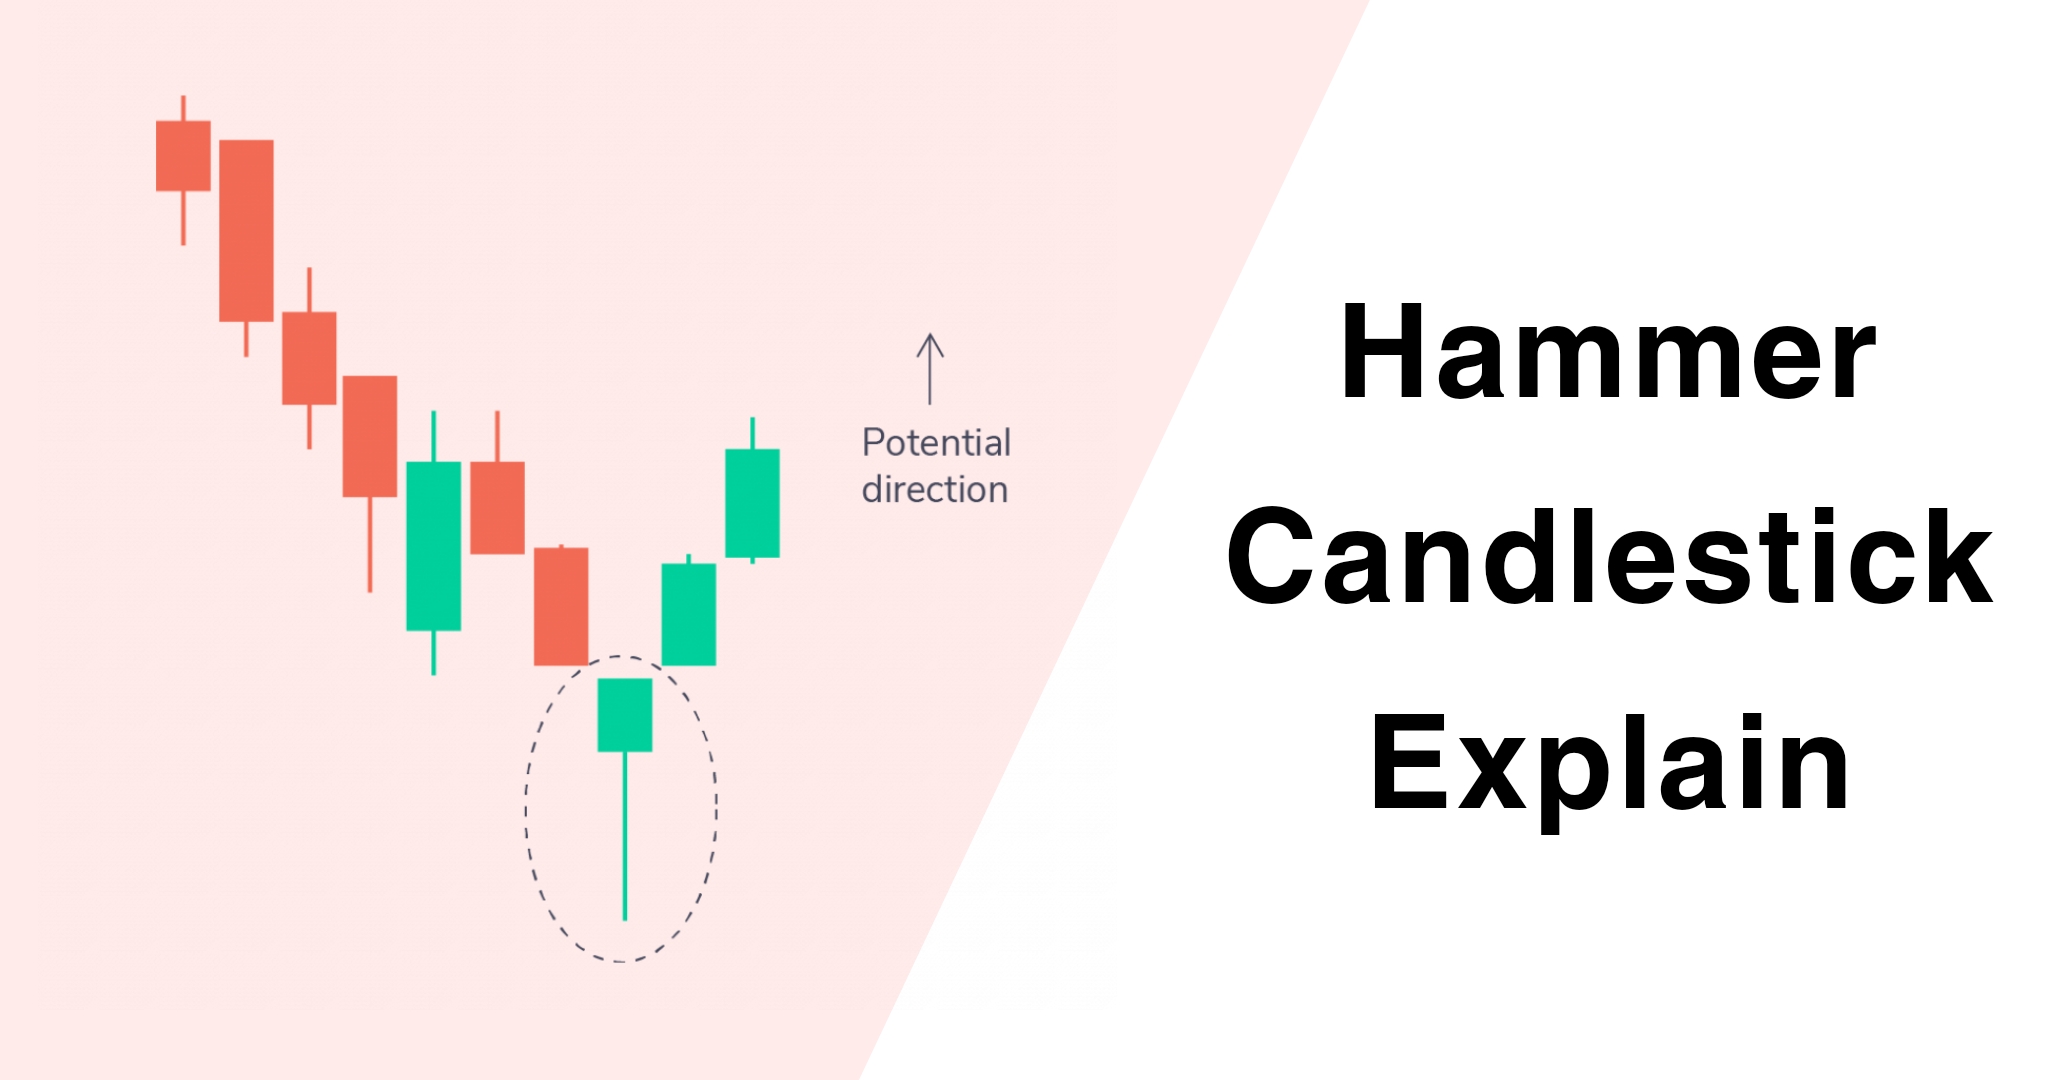
“A hammer candlestick pattern is a bullish reversal pattern, It forms as a single candlestick after a downtrend in the chart. A hammer has a lower shadow which is twice as long as the real body. with almost no upper wick.”
So in this article, we understand how the Hammer candlestick is formed and how we can make trading decisions with it using technical analysis.
Introduction
A hammer Candlestick is a bullish single Candlestick Pattern, Most of traders use hammer candlesticks in their trading as a strategy to identify potential buying opportunities, as it suggests that sellers may be losing momentum and buyers are starting to take control. The hammer is treated as a bullish reversal, but only when it appears under certain conditions.
What is Hammer Candlestick Pattern?
When the closing price of the candle will be higher than the opening price, the bulls have taken control over the prices.
The lower wick or shadow of the candle is at least twice the size of a short body with little or no upper shadow. So the small body indicates that buyers maintained control and prevented further selling pressure.
The hammer candlestick is found at the bottom of a downtrend and signals a potential (bullish) reversal/retracement in the market.
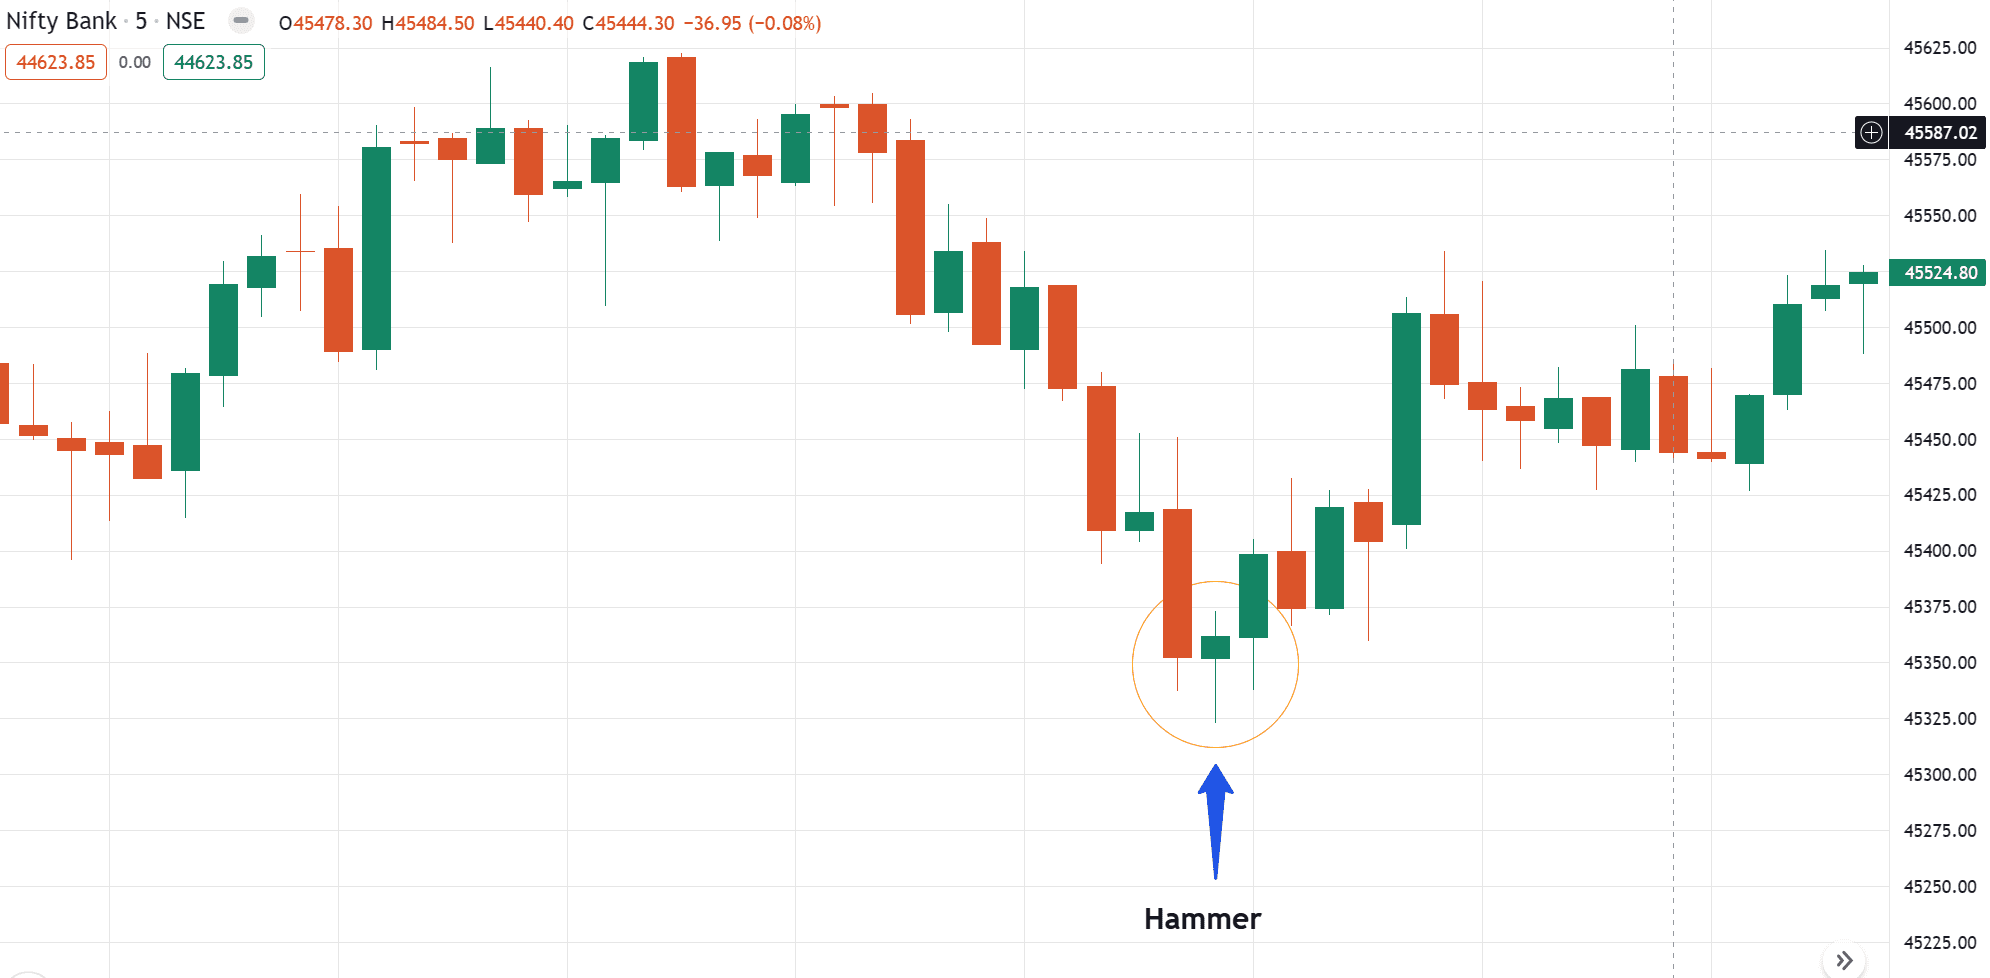
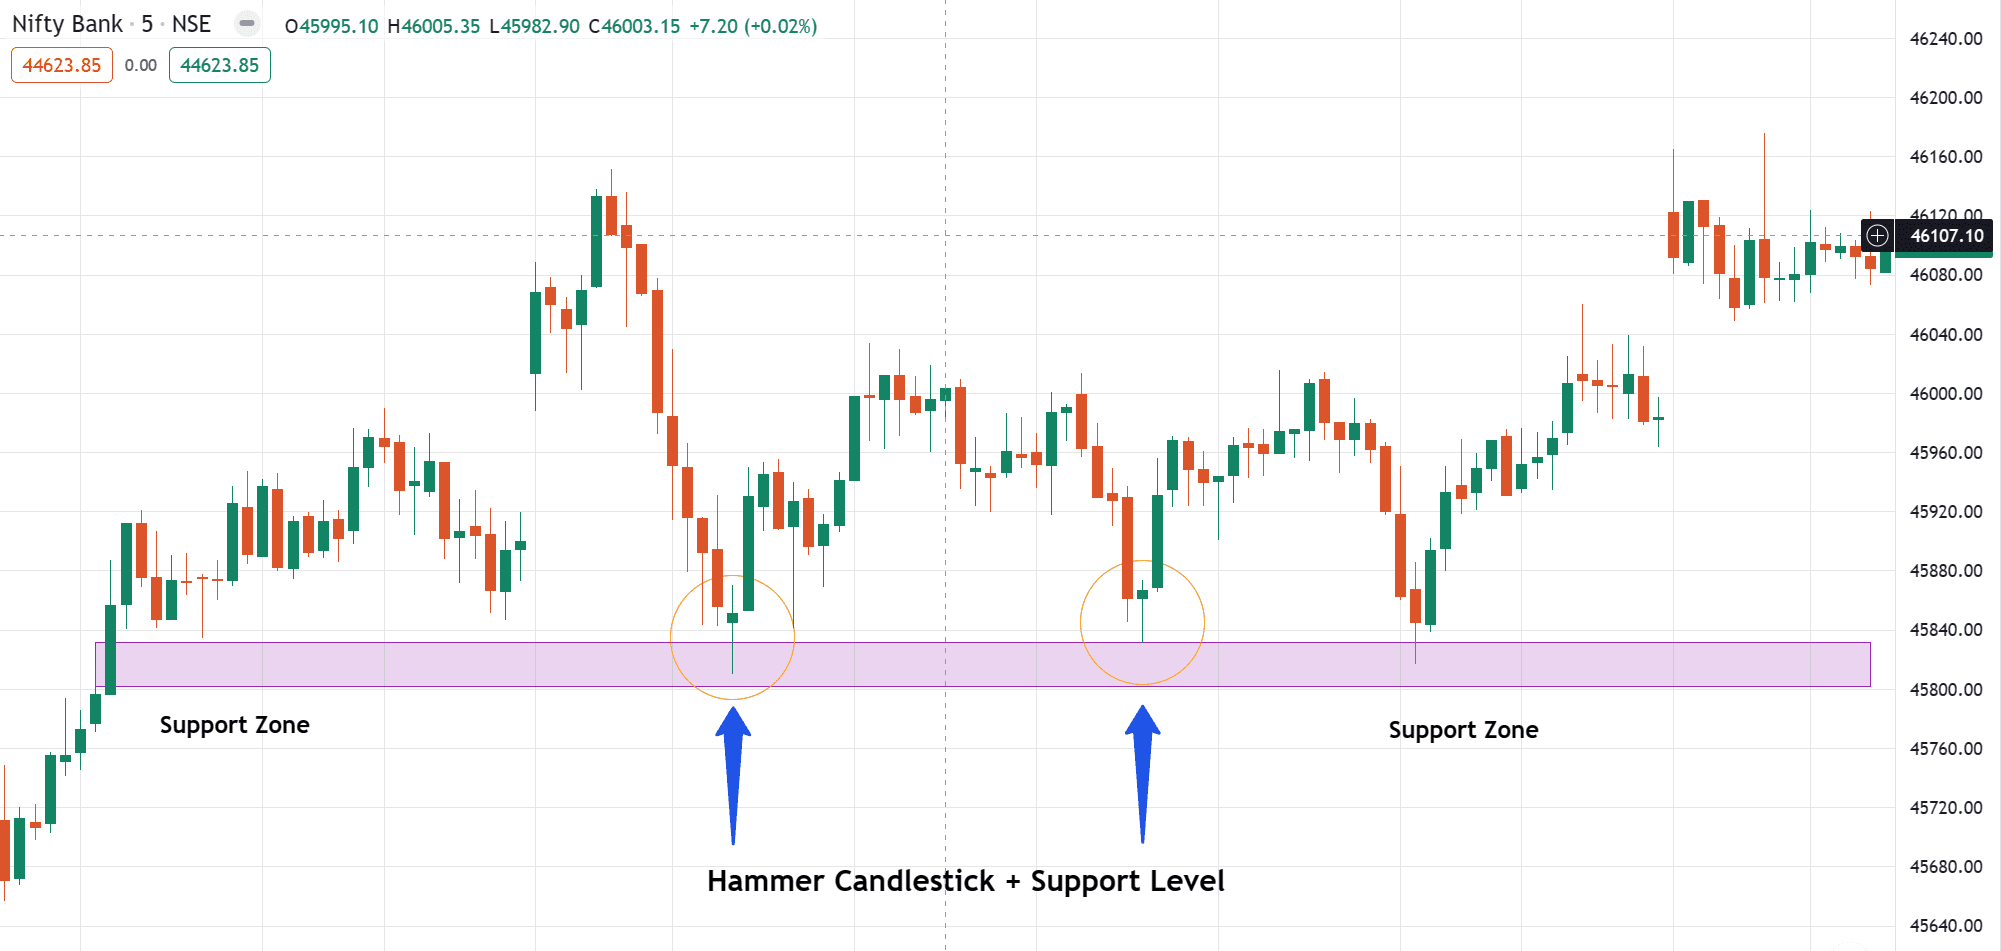
To get a clear idea about the Hammer Candlestick pattern and how it looks like, please Refer the Images of this article with practical knowledge below.

Hammer Candlestick Trade Guide
When identifying this pattern, So you should note the following points:
Traders should enter long positions only after the confirmation of the second candle closing above the hammer candle. Now a stop-loss can be placed at the low of the hammer’s shadow.
A hammer candlestick pattern is a bullish reversal signal characterized by a long lower shadow and a small body at the top, just shown in the examples, The hammer candlestick pattern indicates potential upward price movement. As per our experience when you master it you get approximately 70-80% accuracy.
Hammer Candlestick Trading Strategy Ultimate Guide


Psychology of Hammer Candlestick Pattern
The psychology behind a Hammer candlestick is a most important topic for new traders who newly enter financial markets and don’t know the practical knowledge, so here 5 psychological tips for everyone to master candlestick.
Imagine a market where prices have been falling and falling, and people are feeling negative. but if you know about what is technical analysis, support and resistance concepts so you find opportunities in levels of support. if you are new in the market you find opportunities before the support level and the market can trap you then the market goes up.
- Find the Correct Hammer Candlestick Pattern.
- Check the conditions like lower low formation or at the support level.
- Wait for Confirmation and Enter after confirmation.
- Don’t Overthink and place stoploss accordingly.
- Wait for Target or SL.
Understanding Hammer candlesticks and other candlestick patterns takes some time and practice. It’s not something you can master overnight. So, new traders might make mistakes while learning.
Limitations
Hammer candlesticks are a helpful tool for day traders, but anyone doesn’t always predict what will happen next in the stock market or any other financial market. Sometimes, they give false signals, leading you to make the wrong trading decisions.
Wait for Confirmation because when you see a hammer pattern, it’s like a warning sign, but it’s not enough. So you usually need to wait for another signal or wait for a second candle closing confirmation to confirm if it’s really time to buy. So, you can’t rely on Hammers alone.
Sometimes, a long-shadowed hammer and a strong confirmation candle may push the price quite high within two periods just you can see this like a long leg. This may not be an ideal spot to place a trade because stop loss may be a distance away from the entry point so it doesn’t justify the potential reward.
In simple language, while Hammer candlesticks can be helpful, they’re not a magic solution. They have limitations if you use these limitations in your trading journey you can protect your capital from critical decisions.
Difference Between Hammer Candlestick and Hanging Man
If the hammer candlestick pattern appears in a falling/down trend indicates a bullish reversal or if a pattern with a rising trend suggests a bearish reversal known as a hanging man candlestick pattern.
| Hammer Candlestick | Hanging Man Candlestick |
|---|---|
| The hammer is a bullish trend reversal candlestick pattern. | The hanging man is a bearish trend reversal candlestick pattern. |
| The hammer typically appears at the end of the downtrend. | The hanging man appears at top of an uptrend. |
| When financial market rise from their opening prices after some selling pressure then we get hammer candlestick pattern. | When financial market fall from their opening prices to selling pressure then we get/from hanging man candlestick pattern. |
| Easy way to predit In higher high formation for a retracement. | Easy way to predict In higher high formation for a retracement. |
Key Points
- The Hammer is a bullish reversal candlestick pattern that occurs at the bottom of a downtrend and suggests a potential reversal or retracement from a downtrend to an uptrend.
- Wait for Confirmation: when occurs a hammer candlestick, enter a higher close in the next candlestick. To increase the probability of the Hammer pattern, traders often wait for confirmation.
- A hammer fails if the next candle achieves a new low. (As per my research)
- Hammer doesn’t provide a price target It doesn’t tell you how big the direction of the trend comes.
- The Hammer can be used in various timeframes like 1min, 3min, 5min, 15min, and more as per your conditions and, you can also use in different financial markets. it is a versatile tool for traders.
Also Read: Morning Star Candlestick Pattern Explained
Final Conclusion
In conclusion, The hammer candlestick pattern is a powerful bullish pattern for traders to identify the potential trend reversal signals and predict in future market opportunities. However, it is not a guarantee of success but the hammer candle shows the possibility/probability that the market has changed its direction. When you master it you get approximately 70-80% accuracy. Traders like the Hammer because it’s like a hopeful signal for day traders after a gloomy time.
Remember Trading carries inherent risks, and it’s important to trade responsibly and never risk more capital than you can afford to lose. Some people lose their capital without a proper plan execution and psychological issues, and they don’t handle their risk management in crucial situations.
Leave a comment below and share your thoughts with me. Your feedback is most valuable!
FAQ (Frequently Asked Questions)
Is a hammer bullish or bearish?
A hammer candlestick pattern is a bullish reversal pattern, It forms as a single candlestick after a downtrend in the chart.
Can Hammers be used on different timeframes?
Yes, Hammers can be applied to various timeframes as well as any financial markets, from short-term intraday charts to longer-term daily or weekly charts. but most of the traders used as an intraday strategy.
What are the advantages and disadvantages of hammer candlestick?
Hammers is a single bullish candlestick pattern that shows like a real hammer but it doesn’t provide a price target usually most of the traders plan their trades using support and resistance or tradeline concept, so figuring what the reward potential. it’s usually a retracement against the trend, It doesn’t tell you the how-log direction of the trend so the context is more important than the pattern.


